IELTS Writing Task 1(グラフ・図表)の攻略法

- 目次
- 開く
-
閉じる
こんにちは!IELTS TRAINER PROで正社員として働いている、まりのです。
いつもブログを見てくださって、ありがとうございます!
今回はIELTS Writing Task 1「グラフ・図表」の攻略法をご紹介します!
あくまでも私個人の見解なので、参考程度にしていただけますと幸いです。
IELTS Writing Task 1とは?
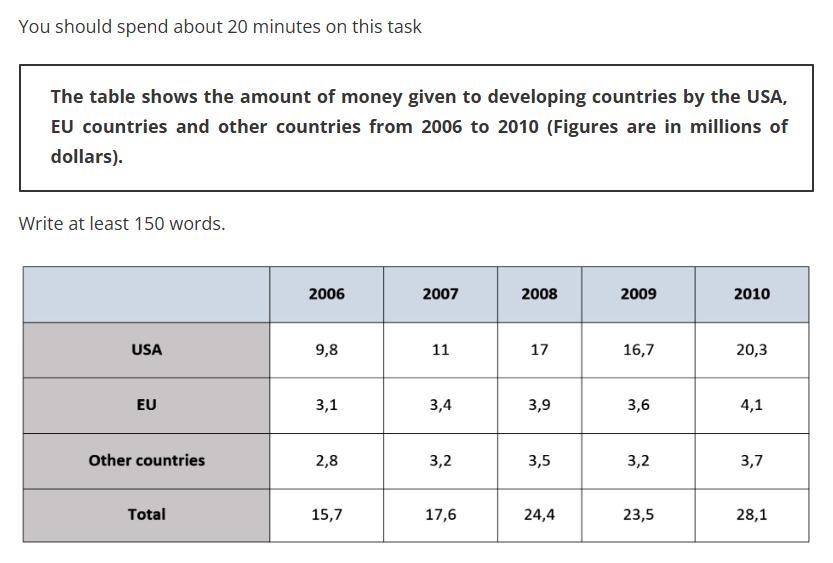
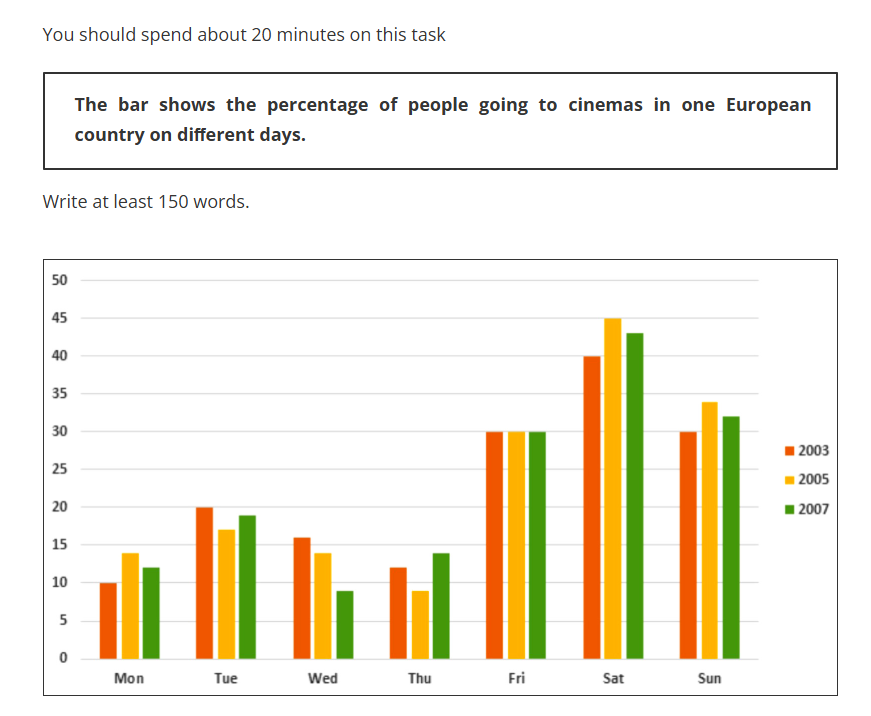
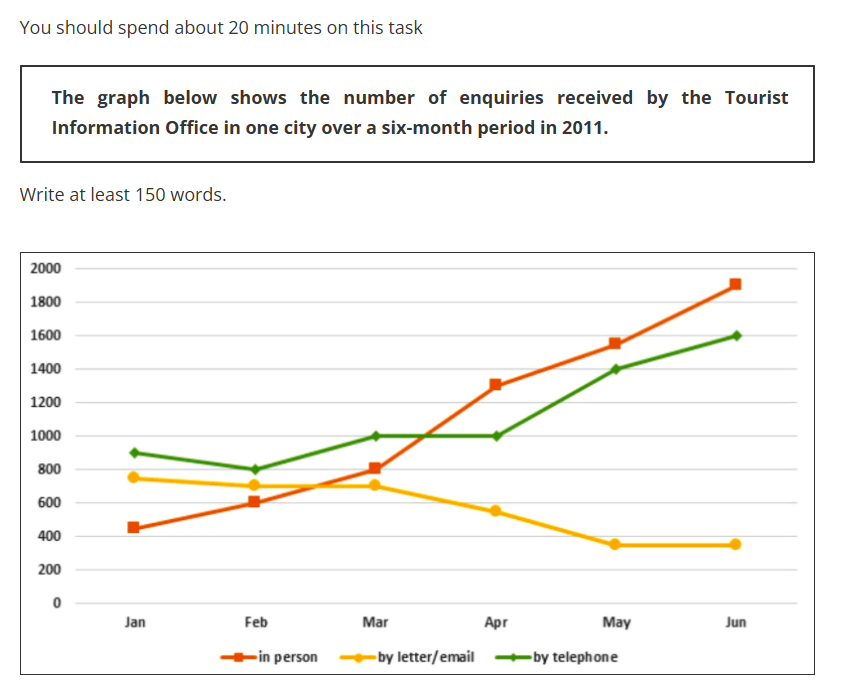
IELTS Writing Task 1では、図やグラフが出題されます。
代表的なものとしては画像でも載せている「表(Table)」「折れ線グラフ(Line Graph)」「棒グラフ(Bar Graph)」があります。
これらは頻出問題ですので、しっかりと書けるようにしましょう。
そしてたまに出題されるのが「地図」や「ダイアグラム」、「フローチャート」です。
「地図」や「ダイアグラム」に関してはまぁまぁ出てくるのですが、「フローチャート」は私もITPの他のスタッフもIELTS本試験で経験したことがないくらい出題される確率が少ないです。
IELTS Writing Task 1で使える表現を紹介!
ここからはIELTS Writing Task 1で使える表現を紹介します!
- データの概要を述べる表現
・The graph illustrates…(グラフは~を示している)
・The table provides information about…(表は~に関する情報を提供している)
・The chart compares…(チャートは~を比較している)
・The diagram depicts…(図は~を表している)
・Overall, it is clear that…(全体的に明らかなのは~) - 数値の変化を表す動詞
・increase(~増加する)
・rise(~上昇する)
・grow(~成長する)
・decrease(~減少する)
・decline(~低下する)
・drop(~落ちる) - 変化の程度を表す副詞・形容詞
・dramatically(劇的に)
・significantly(著しく)
・sharply(急激に)
・rapidly(急速に)
・gradually(徐々に)
・slightly(わずかに)
・moderately(適度に) - 比較・対照の表現
・compared to…(~と比較すると)
・in contrast to…(~とは対照的に)
・while / whereas(一方で)
・on the other hand(一方で) - 最高・最低・ピークを表す表現
・reach a peak of…(~のピークに達する)
・hit the highest point at…(~の最高点に達する)
・fall to the lowest point at…(~の最低点に落ちる)
IELTS Writing Task 1のサンプル問題とアンサー
最後にIELTS Writing Task 1のサンプル問題とアンサーを紹介します!
Sample Answer
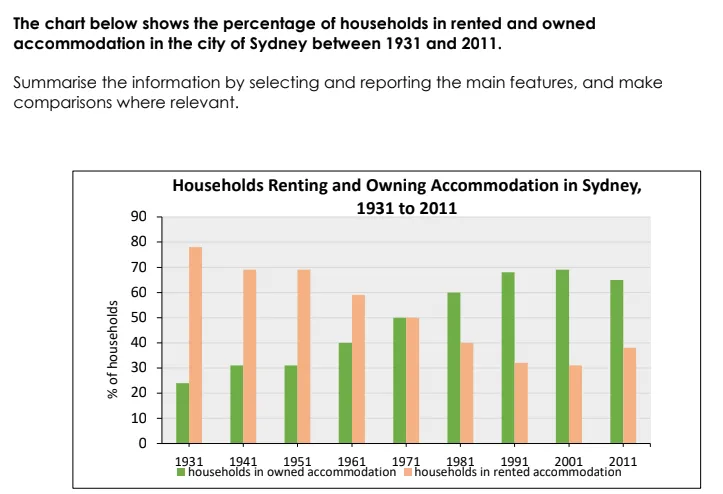
The given bar illustrates the percentage of households who rented and owned their accommodation in the city of Sydney from 1931 to 2011.
Overall, the percentage of households renting accommodation decreased, whereas the number of households owning accommodation rose.
Moving to the details, in 1931, approximately 78% of Sydney households lived in rented accommodation. This rate fell significantly by about 10% in each time period except from 1941 to 1951 and 1991 to 2001 where it remained steady at around 69% and 32%, respectively. In comparison with 1931, the percentage in 2011 was lower by about 40%.
Meanwhile, households having their own accommodation started at approximately 25%, which was the lowest. It increased by about 5% in 1941, and then it stayed constant for the next 10 years. In 1971, the number of households in owned accommodation was as high as those who rented their accommodation. The percentage grew considerably, reaching its peak at nearly 70%. Compared to households who were renting, those living in their own house was higher by less than 30% at the end of the period.
まとめ
今回も最後まで読んでいただきありがとうございました!
IELTS Writing Task 1(Academicモジュール)では、グラフや図表が出題され、そこからデータを読み取り文章を書く必要があります。
そしてWriting Task 1でもなるべく同じような表現を使うことは避け、様々な表現を使用していくことを推奨しています。
そこで今回紹介した様々な表現を用いてWriting Task 1を書いてみてください。
IELTS TRAINER PROでは、IELTS Writingに特化したライティング強化コースも提供しています。
ご興味のある方はお気軽にIELTS TRAINER PROの無料カウンセリングへお越しください。