IELTS Writing Task1完全攻略②|図表別テンプレと回答例

- 目次
- 開く
-
閉じる
本記事は「IELTS Writing Task1完全攻略①|評価基準と基本構成」の続編です。第1弾を未読の方は、先に「評価基準と基本構成」を確認してから本記事を読むのがおすすめです。
本記事では、図表別のテンプレートと回答例、そのまま使える英語表現、よくあるミスと改善ポイントをまとめて解説します。
IELTS Writing Task1で使いやすい表現や回答の型を整理したい方は、ぜひ最後までご覧ください。
1.【図表別】IELTS Writing Task 1テンプレ&サンプルアンサー
まず初めに多くの方が気になっているであろうIELTS Writing Task 1の図表別のテンプレやサンプルアンサーを紹介していきます。
① 折れ線グラフ(Line Graph)
第1弾の記事でも紹介しましたが、IELTS Writing Task 1で最も出題頻度が高いと言われているのが折れ線グラフ(Line Graph)です。典型的な出題パターンとしては、時間経過に伴った数値の変化(上昇・下降・横ばい)を表す「各国のある特産物の輸出入について」や「ある国の人口推移」などが出題されます。
IELTS Writing Task 1の折れ線グラフ(Line Graph)では以下の必須表現をおさえておきましょう。
| 上昇を表す表現 | rose steadily, increased sharply, climbed gradually |
| 下降を表す表現 | fell dramatically, declined slightly, dropped significantly |
| 横ばいを表す表現 | remained stable, plateaued at, leveled off |
| ピーク等を表す表現 | reached a peak of, hit a low of |
IELTS Writing Task 1の折れ線グラフ(Line Graph)のバンドスコア7のサンプルアンサーを見てみましょう。
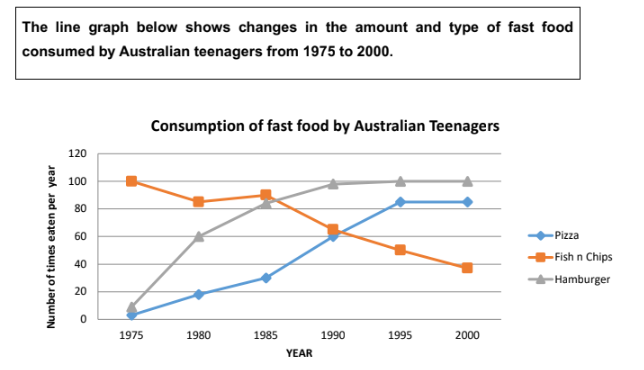
This line graph illustrates the comparison data about the fast food consumption of
teenagers in Australia between 1975 and 2000, a period of 25 years.
In brief, the consumption of fish and chips declined over the period, whereas the amount of pizza and hamburgers that were eaten increased.
Turning to the detail, in 1975, the most popular fast food for Australian teenagers was
fish and chips, being eaten 100 times a year. This was far higher than pizza and
hamburgers, which were consumed approximately 5 times a year. However, apart from
a brief rise again from 1980 to 1985, the consumption of fish and chips gradually declined over the 25-year timescale to finish at just under 40.
In sharp contrast to this, teenagers ate the other two fast foods at much higher levels. Pizza consumption increased gradually until it overtook the consumption of fish and chips in 1990. It then leveled off from 1995 to 2000. The biggest rise was seen in hamburgers as the occasions they were eaten increased sharply throughout the 1970’s and 1980’s, exceeding that of fish and chips in 1985. It finished at the same level that fish and chips began, with consumption at 100 times a year.
(203 words)
上記のIELTS Writing Task 1のサンプルアンサーのように折れ線グラフでは、全体の傾向(Overview)を必ず含め、数値を引用しながら上昇しているか、下降しているかを具体的に記述していきましょう。
② 棒グラフ(Bar Chart)
IELTS Writing Task 1で折れ線グラフと並んで出題頻度が高いと言われているグラフがここで紹介する「棒グラフ(Bar Chart)」です。典型的な出題パターンとしては、「複数カテゴリーの数値比較がメインとなっており、「ある国で楽しまれているスポーツ」や「国ごとの人口変化」などが出題されます。
IELTS Writing Task 1の棒グラフでは以下の表現を押さえておきましょう。
| 数値の大小を表す表現 | account for, make up, represent, record |
| 最大・最小を表す表現 | the highest/lowest figure, the largest/smallest amount, the most/least popular |
| 比較・対比を表す表現 | compared to, while, whereas, in contrast |
| 順位・補足を整理する表現 | followed by, respectively, in second place |
IELTS Writing Task 1の棒グラフ(Bar Chart)のバンドスコア7のサンプルアンサーを見てみましょう。
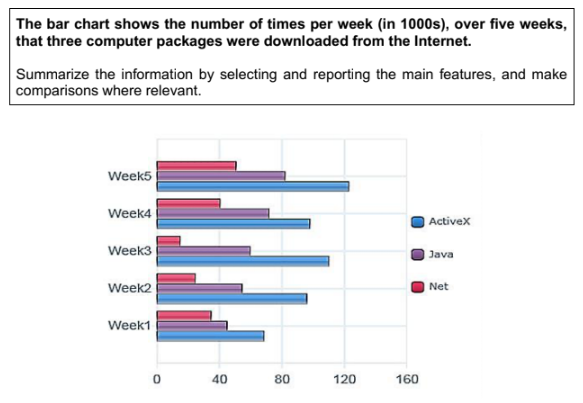
The bar chart illustrates the download rate per week of ActiveX, Java, and Net computer packages over a period of five weeks.
In brief, it can clearly be seen that ActiveX was the most popular computer package to download, whilst Net was the least popular of the three.
Moving on to the details, downloads of ActiveX and Java showed similar patterns, with
both gradually increasing from week 1 to week 5. However, the purchases of Active X
remained significantly higher than the other product over this time frame. In week 1, the purchases of ActiveX stood at around 75,000, while those for Java were at about 30,000 lower. With the exception of a slight fall in week 4, downloads of ActiveX kept increasing until it reached a peak in the final week of just over 120,000. Java downloads also increased at a steady rate, finishing the period at 80,000.
The product that was downloaded the least was Net. This began at slightly under 40,000, and, in contrast to the other two products, fell over the next two weeks to reach a low of approximately 25,000. It then increased sharply over the following two weeks to finish at about 50,000, which was well below that of ActiveX.
(206 words)
上記のIELTS Writing Task 1のサンプルアンサーのように棒グラフでは、概要(Overview)で最大値・最小値を先に提示し、比較や対比を表す表現、そして順位や補足を表す表現を用いて無駄なく整理されています。
③円グラフ(Pie Chart)
IELTS Writing Task 1の円グラフ(Pie Chart)では、「全体に占める各項目の割合」が典型的な出題パターンです。具体的には「ある国へ移住した理由の割合」や「アンケート調査の結果」のような問題が出題されます。若干棒グラフと似ていますが、円グラフは必ず「全体の中での比率」として書く必要がありますので、単純に数値を並べるのではなく項目同士の関係性を表すことがハイスコア獲得へのカギとなるでしょう。
IELTS Writing Task 1の円グラフでは以下の表現を押さえておきましょう。
| 割合を示す動詞 | account for, make up, represent, constitute, comprise |
| 最大・最小を示す表現 | the largest/smallest proportion, the majority of, nearly half, just over/under |
| 比較・対比を示す表現 | compared to, while, whereas, in contrast |
| 割合の言い換え表現 | one in three, two-thirds, almost half |
IELTS Writing Task 1の円グラフ(Pie Chart)のバンドスコア7のサンプルアンサーを見てみましょう。
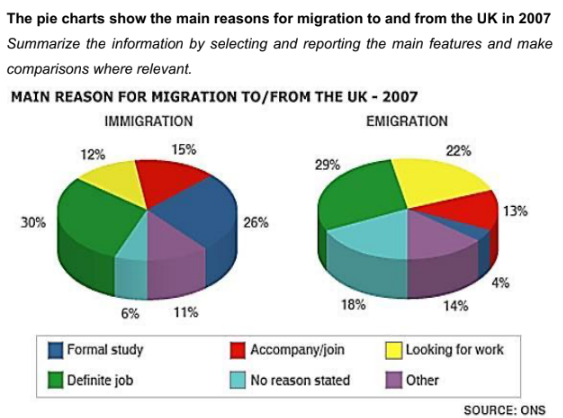
The pie charts illustrate the primary reasons that people came to and left the UK in 2007.
In brief, it is clear that the main factor influencing this decision was employment.
Moving to the detail, having a definite job accounted for 30 per cent of immigration to the UK, and this figure was very similar for emigration, at 29%. A large number of people, 22%, also emigrated because they were looking for a job, though the proportion of people entering the UK for this purpose was noticeably lower at less than a fifth.
Another major factor influencing a move to the UK was for formal study, with over a quarter of people immigrating for this reason. However, interestingly, only a small minority, 4%, left for this. The proportions of those moving to join a family member were quite similar for immigration and emigration, at 15% and 13% respectively. Although a significant number of people (32%) gave ‘other’ reasons or did not give a reason why they emigrated, this accounted for only 17% with regard to immigration.
(176 words)
上記のIELTS Writing Task 1のサンプルアンサーでは、12%を「a fifth」を使って5分の1と表していたり、1番大きい割合については概要(Overview)で簡潔に述べています。円グラフでは数字の言い換えを意識的に練習しておくことが、ハイスコアを獲得するための最大のポイントとなるでしょう。
④表(Table)
IELTS Writing Task 1の表(Table)は、意外と苦手とするIELTS受験者の方が多いです。典型的な出題パターンとしては、「複数の国・年・カテゴリにまたがるデータの比較」のため情報量が多く、何をどのようにどんな順番で書けばよいのかわからなくなってしまうことが多々あります。しかしながら、表は他のグラフとは異なりすべての数値を記述する必要はなく、最大値・最小値・目立った部分・全体傾向の4点に絞って記述していきましょう。
IELTS Writing Task 1の表では以下の表現を押さえておきましょう。
| 数値の大小・順位を示す表現 | the highest/lowest figure, ranked first/last, topped the list |
| 比較・差を示す表現 | significantly higher/lower than, nearly double, roughly three times as much as |
| 変化を示す表現 | increased/decreased by, rose from A to B, remained relatively stable |
| データの選別・補足を示す表現 | notably, in particular, it is worth noting that |
IELTS Writing Task 1の表(Table)のバンドスコア7のサンプルアンサーを見てみましょう。
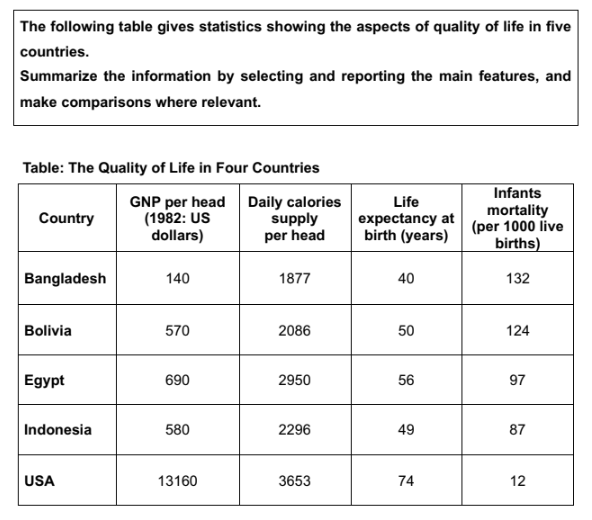
The table uses four economic indicators to show the standard of living in five selected
countries in 1982.
In brief, it can be seen that the quality of life in the USA was far higher than the other four countries.
Turning to the detail, the USA, which is a developed country, had the highest GNP at
13,160 dollars per head. It also had a much higher daily calorie intake and life expectancy, and the lowest rate of infant mortality.
The other developing countries had quality of life ratings that were significantly lower. The range of indicators for Egypt, Indonesia, and Bolivia were similar, with Egypt having the highest quality of life amongst the three. However, the infant mortality rate in Egypt was slightly higher than Indonesia’s at 97 deaths per 1000 compared to 78 in Indonesia.
Bangladesh had by far the lowest quality of life in all the indicators. Its GNP was about one hundred times smaller than the USA’s. Its calorie intake and life expectancy were about half those of the USA, and its infant mortality rate was 10 times greater.
(182 words)
上記のIELTS Writing Task 1のサンプルアンサーでは、すべての数値を羅列せず目立った変化や対比に沿って記述しています。「significantly lower」などの数値だけに頼らない表現を使用したりしているのも特徴です。
⑤地図(Map)
IELTS Writing Task 1の地図(Map)は、他のグラフと比べて出題頻度が低いため対策が手薄になりやすいです。そのため多くの方が対策を何もせずにIELTS本試験で地図問題が出題されてうまく書けなかったとなってしまいます。典型的な出題パターンとしては、「同じ場所の過去と今、もしくは今と未来」のパターンが多いです。
以下のIELTS Writing Task 1の地図問題で必須となる表現を押さえておきましょう。
| 位置・方角を示す表現 | in the north/south/east/west of, to the left/right of, in the centre of, adjacent to, opposite |
| 変化を示す表現 | was replaced by, was demolished, was constructed, was extended, was converted into |
| 比較を示す表現 | while, whereas, in contrast, unlike |
| 位置関係を補足する表現 | surrounded by, connected to, located between A and B, along the |
IELTS Writing Task 1の地図(Map)のバンドスコア7のサンプルアンサーを見てみましょう。
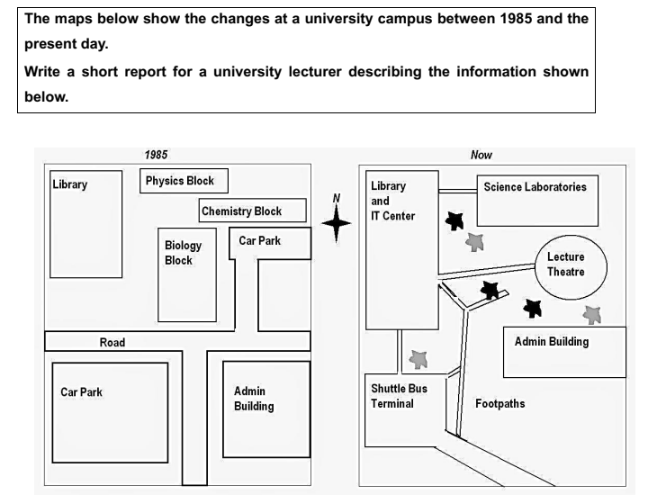
The given diagram depicts the changes incorporated in a university campus between 1985 and the present.
In brief, substantial changes have taken place at the university campus with the amalgamation and construction of several departments and buildings. Also, the campus has been redesigned in a more pedestrian friendly manner.
In 1985, the northern area of the campus consisted of three science blocks (physics, chemistry, and biology), a library, and small car park, while the southern region had a large car park to the southwest and an admin building to the southeast. A road ran east to west, with a branch to the northern car park and another to the southern end of the map, between the car park and admin building.
Today, however, the library has been expanded to include an IT center, whilst the science blocks have been combined into one laboratory. To make the area more accessible for people, the roads have been removed and a shuttle bus terminal built, in place of the southern parking area, and a network of footpaths added. The admin building was rebuilt smaller than that in 1985 together with a circular lecture theater. Finally, many trees have been added around the campus.
(200 words)
上記のようなIELTS Writing Task 1の地図(Map)問題では、変化の描写に受動態(has been redesigned)を使用していくのが重要となります。また、受動態を使いつつも方角なども反射的に記述できるように徹底して練習しておきましょう。
2.IELTS Writing Task 1でそのまま使える!必須英語表現リスト
ここからはIELTS Writing Task 1で使える表現リストをご紹介します!これだけ覚えておくことでIELTS本試験でも練習問題でもスムーズに文章を書けるようになりますので、是非覚えてみてください!
増減を表す表現(動詞/名詞/副詞セット)
増減を表す表現は動詞・名詞・副詞をセットで覚えておくことをおすすめします!
| 【上昇を表す表現】 | |
| 動詞 | rise, increase, grow, climb, surge, soar, recover, rebound |
| 名詞 | a rise, an increase, a growth, a climb, a surge, a recovery, a rebound |
| 副詞(程度) | sharply, dramatically, significantly, steadily, gradually, slightly |
| 【下降を表す表現】 | |
| 動詞 | fall, decrease, decline, drop, plunge, plummet, dip |
| 名詞 | a fall, a decrease, a decline, a drop, a plunge, a dip |
| 副詞(程度) | sharply, dramatically, significantly, steadily, gradually, slightly |
| 【横ばいを表す表現】 | |
| 安定して推移した | remained stable / steady |
| 横ばいになった | leveled off / plateaued |
| ほとんど変化がなかった | showed little change |
| およそ~で推移した | stayed at approximately |
比較・対照の表現
棒グラフや円グラフ、表、地図で特に重要なカテゴリーとなっております。
| 【比較・対照表す表現】 | |
| compared to / with | The number of customers increased by 10 compared to the previous month. |
| relative to | Sales increased by 20% relative to the same period last year. |
| in comparison with | In comparison with last year, we have had very little rain this summer. |
| 【対照・逆接を示す表現】 | |
| while / whereas | The north of the country is industrial, whereas the south is mostly agricultural. |
| in contrast | In contrast to the steady growth of the domestic market, international sales have stagnated. |
| on the other hand | On the other hand, the number of children remained stable at 10 million. |
| however | However, the figure of sales reached 10 billion yen. |
| unlike | Unlike our competitors, we saw a decrease in customer churn during the price hike. |
| 【差の大小を示す表現】 | |
| ~より大幅に高い・低い | significantly higher / lower than |
| ほぼ2倍・3倍 | nearly double / triple |
| およそ2倍 | roughly twice as much as |
| わずかに高い・低い | marginally higher / lower than |
| はるかに大きい・小さい | far greater / smaller than |
割合・数値の表現
IELTS Writing Task 1の円グラフ・棒グラフ・表で必ず必要になる表現です。数字をそのまま記述するのではなく、言い換え表現と組み合わせて行うと良いでしょう。
| 【割合を示す表現】 | |
| account for | Snacks accounted for 60% of expenditure. |
| make up | Vegetables made up a quarter of the total. |
| represent | Housing represented the smallest share. |
| constitute / comprise | Electricity constituted approximately 25% of energy use. |
| 【割合の言い換え表現】 | |
| 50% | half / one in two |
| 33% | one-third / one in three |
| 25% | a quarter / one in four |
| 75% | three-quarters |
| 約10% | approximately one in ten |
| 10%未満 | just under 10% / less than one in ten |
| 10%超 | just over 10% |
| 【数値の概数表現】 | |
| およそ~ | approximately / roughly / around |
| ~をわずかに超える・下回る | just over / just under |
| ほぼ~ | nearly / almost |
| ちょうど~ | exactly |
順序・プロセスの表現
IELTS Writing Task 1のプロセスで必要な表現を紹介していきます。何度も本記事でもお伝えしておりますが、同じ表現を何度も繰り返すとスコアが上がりにくくなりますので、以下でご紹介する表現を最低でも5個覚えるようにしましょう。
| 【割合を示す表現】 | |
| 最初 | First, Firstly, To begin with, Initially |
| 次 | Then, Next, Subsequently, Following this |
| その後 | After that, Afterwards, At the next stage |
| 同時 | Meanwhile, At the same time, Simultaneously |
| 最後 | Finally, Lastly, At the final stage |
| 【プロセスの接続表現】 | |
| before being~ | All personal information was encrypted before being stored in the database. |
| after which | The participants were monitored for six months, after which a follow-up survey was conducted. |
| where it is then~ | The heated mixture is moved to a cooling chamber, where it is then condensed into a liquid form. |
| in order to~ | The raw tea leaves are dried in the sun in order to reduce their moisture content. |
Overviewで使える表現まとめ
Overview(概要)はIELTS Writing Task1で特に重要なパートです。試験官が最初に確認するセクションのため、複数の書き出し方を使えるようにしておきましょう。
| 【Overviewの書き出し表現】 | |
| Overall, | 最も使われる表現で、シンプル |
| In general, | Overallの言い換えとして使用可能 |
| As an overall trend, | 若干丁寧な表現 |
| The most striking feature is that, | 目立った特徴を強調したいとき |
| What stands out most is that, | 同上だが、やや口語的 |
3.よくあるミスと改善ポイント【Task1対策】
IELTS Writing Task 1を対策していく中で、「勉強しているのにバンドスコアが伸びない」という方が多くいらっしゃいます。このような方々は同じようなミスを繰り返している可能性がありますので、これから紹介する「よくあるミス」をしていないか確認してみましょう。
Overviewを書かない・薄い
IELTS Writing Task 1の評価基準の1つである「Task Achievement」でハイスコアを獲得したいのであれば、「Overview」を必ず書くようにしましょう。Overviewではグラフの大まかな傾向を表すのですが、この部分を書かずにデータの詳細だけを書くとバンドスコア5程度で止まってしまうことがほとんどです。また、Overviewを書いていないだけでなく、内容が薄くなってしまうパターンの方も多くいらっしゃるのでしっかりとOverviewは書けるようにしましょう。
❌ 悪い例(内容が薄い・不十分)
Overall, there were changes in the consumption of tea and coffee from 1990 to 2010. Both drinks were popular during the period.
✅ 良い例(ハイスコアが狙える構成)
Overall, it is clear that while tea remained the most consumed beverage throughout the period, its popularity saw a gradual decline. In contrast, coffee consumption experienced a significant upward trend, narrowing the gap between the two drinks by 2010.
数値の羅列になってしまう
IELTS Writing Task 1で最も多いミスの1つがデータ(数値)をただひたすら順番に並べるだけの文章になってしまうことです。IELTS Writing Task 1の評価基準の「Coherence & Cohesion」では、情報がどれだけ論理的に整理されているかが問われますので、数値を並べるだけの文章にならないようにしましょう。
❌ 悪い例(数字の羅列・単調)
In 1990, tea consumption was 100 units and coffee consumption was 20 units. In 2010, the figure for tea fell to 80 units while coffee rose to 70 units.
✅ 良い例(情報の整理・比較あり)
Starting at 100 units in 1990, tea consumption gradually dipped to 80 units by the end of the period. In stark contrast, coffee saw a nearly fourfold increase, surging from a mere 20 units to 70 units, which almost leveled with tea’s consumption.
IELTS Writing Task 2のように意見を書いてしまう
初心者の方がやりがちなのですが、IELTS Writing Task 1の文章で「I think…」や「in my opinion」のような表現を使用し「将来的にはこうなるだろう」のような自分の意見を書いてしまうことがあります。また、エッセイに書きなれている方も自分の意見や推測を書いてしまうミスをしてしまいがちです。ですが、IELTS Writing Task 1は客観的な描写が求められるタスクなので、自分の意見や推測を書かないようにしましょう。
❌ 悪い例(意見や推測が含まれている)
Overall, coffee consumption increased significantly. This is probably because more people needed caffeine to work longer hours in the office. In my opinion, this is a negative trend because tea is generally healthier than coffee.
✅ 良い例(客観的な事実のみに徹している)
Overall, coffee consumption showed a significant upward trend throughout the period. This growth resulted in coffee narrowing the gap with tea, which remained the most consumed beverage despite a gradual decline in its figures.
語彙・表現のバリエーション不足
IELTS Writing Task 1の評価基準の1つである「Lexical Resource(語彙力)」の部分で多様な英単語もしくは英語表現が使用されているかが評価されます。つまり、同じ表現や英単語を繰り返し使用するとこの部分の評価が下がり、全体のバンドスコアにも影響を及ぼす可能性があります。
❌ 悪い例(語彙が乏しく、同じ表現の繰り返し)
The number of coffee drinkers went up from 20 to 40 in 2000. After that, it went up again to 70 in 2010. On the other hand, the number of tea drinkers went down a lot in the same period.
✅ 良い例(多彩な語彙と表現を使用)
The number of coffee drinkers doubled to 40 in 2000, before climbing further to reach a peak of 70 by 2010. Conversely, tea consumption witnessed a dramatic decline over the same twenty-year timeframe.
4.まとめ
本記事ではIELTS Writing Task 1の図表別テンプレ、サンプルアンサー、そしてよくあるミスと改善点についてお伝えしてきました。
IELTS Writing Task 1では、図表のタイプを瞬時に判断し、適切な語彙・表現を用いて文章を作成する能力が問われるタスクです。そのためにも本記事で紹介したたくさんの表現を繰り返し練習し、実際のIELTS Writing Task 1の問題にあてはめながら定着させていきましょう。
繰り返しになりますが、本記事の第1弾である「IELTS Writing Task 1完全攻略①|評価基準と基本構成」を読んでいない方はそちらも併せてご確認ください。IELTS Writing Task 1の評価基準や基本的な構成が理解できているからこそ、本記事の内容の理解が深まるのではないかと思います。
IELTS Writing Task 1対策において、まずは型を覚えることから始めましょう!一つひとつの表現を実際のIELTS試験で使いこなせるようになるまでたくさん練習してみてください!
IELTS TRAINER PROの体験レッスンをご希望の方は以下のリンクからお申込みください!